


Chart of the Week: Creating a .NET MAUI Column Chart to Visualize the Corporate Investment in AI


TLDR: Gathering and binding the data on the corporates’ investment in AI over the years and visualizing the data using the Syncfusion .NET MAUI Column Chart. We’ll also customize the chart’s title, axis, series, background view, and other elements for better readability.
Welcome to the Chart of the Week blog series!
[Artificial intelligence (AI)](en.wikipedia.org/wiki/Artificial_intelligence "Wikipedia article: Artificial intelligence (AI)") has recently emerged as a critical area for corporate funding, with businesses across diverse sectors recognizing its capacity to revolutionize their operations. The allure of AI investments lies in their ability to enhance productivity, drive innovation, and secure a competitive advantage.
The year 2021 is notable for AI investment, as the sector has received a record-breaking $276.1 billion in funding. This surge in financial backing reflects a growing confidence in AI’s ability to catalyze innovation, elevate efficiency, and transform industries on a global scale.
The following image demonstrates the chart that we intend to construct.
Let’s delve into the steps to visualize corporates’ AI investment data using the Syncfusion [.NET MAUI Column Chart](syncfusion.com/maui-controls/maui-cartesian.. ".NET MAUI Column Chart").
Step 1: Gathering the data on AI investment
Before proceeding, we should gather the data for the chart. Here, we’ll refer to the [Stanford University analysis](aiindex.stanford.edu/wp-content/uploads/202.. "Article: Artificial Intelligence Index Report 2023"), which provides comprehensive information on corporate investment in AI and extract data from it. Specifically, we examined the page number 184.
Step 2: Populate the data for the chart
Define the ArtificialIntelligenceModel class with the following properties:
- Year – To represent the year of investment.
- Value – To hold the invested amount in U.S. billion dollars.
Refer to the following code example.
public class ArtificialIntelligenceModel { public string Year { get; set; } public double Value { get; set; }
public ArtificialIntelligenceModel(string year, double value) { Year = year; Value = value; } }
Now, generate the data collection that illustrates the investment details using the ArtificialIntelligenceData class with the Data property.
public class ArtificialIntelligenceData { public List Data { get; set; }
public ArtificialIntelligenceData() { Data = new List() { new ArtificialIntelligenceModel("2022",189.59), new ArtificialIntelligenceModel("2021",276.14), new ArtificialIntelligenceModel("2020",146.74), new ArtificialIntelligenceModel("2019",95.57), new ArtificialIntelligenceModel("2018",79.62), new ArtificialIntelligenceModel("2017",53.72), new ArtificialIntelligenceModel("2016",33.83), new ArtificialIntelligenceModel("2015",25.43), new ArtificialIntelligenceModel("2014",19.04), new ArtificialIntelligenceModel("2013",14.57), }; } }
Step 3: Configure the Syncfusion .NET MAUI Cartesian Charts
Let’s configure the Syncfusion .NET MAUI Cartesian Charts control using this [documentation](help.syncfusion.com/maui/cartesian-charts/g.. "Getting started with the .NET MAUI Cartesian Charts control").
Refer to the following code example.
Step 4: Bind the investment data to the .NET MAUI Column Chart
Then, create a [Column Chart](help.syncfusion.com/maui/cartesian-charts/c.. "Getting started with the .NET MAUI Column Chart") to display the AI investment data for different years. The following code example demonstrates how to bind the collected data to our chart.
Here, we’ve bound the Data to the ItemsSource property. The XBindingPath and YBindingPath properties are bound to the Year and Value properties, respectively.
Step 5: Customize the chart appearance
Let’s customize the appearance of the .NET MAUI Column Chart for better visualization.
Adding the chart title
Adding a title to the Chart improves the data’s readability. Refer to the following code example.
Customizing the chart axis
Here, we will enhance the appearance of the axis line by initializing the chart axis in the code behind. Refer to the following code example.
C#
public class CategoryAxisExt : CategoryAxis { }
public class NumericalAxisExt : NumericalAxis { }
In the above code example, we’ve created an extension for the standard CategoryAxis with the CategoryAxisExt class and NumericalAxis with the NumericalAxisExt class.
Here, we will replicate the chart’s axes with the arrow mark at the ends. To achieve this, override the DrawAxisLine method within the CategoryAxisExt and the NumericalAxisExt classes. This is a crucial step in customizing the axis line.
public class CategoryAxisExt : CategoryAxis { protected override void DrawAxisLine(ICanvas canvas, float x1, float y1, float x2, float y2) { var path = new PathF(); path.MoveTo(x1 + 20, y1); path.LineTo(x2, y2);
// Calculate the direction vector of the line. float dx = x2 - x1; float dy = y2 - y1;
// Normalize the direction vector. float length = (float)Math.Sqrt(dx * dx + dy * dy); float nx = dx / length; float ny = dy / length;
// Length of the arrowhead. float arrowLength = 15;
// Calculate points for the arrowhead. float arrowPoint1X = x1 + nx * arrowLength + ny * arrowLength / 2; float arrowPoint1Y = y1 + ny * arrowLength - nx * arrowLength / 2; float arrowPoint2X = x1 + nx * arrowLength - ny * arrowLength / 2; float arrowPoint2Y = y1 + ny * arrowLength + nx * arrowLength / 2;
// Draw lines for the arrowhead. path.MoveTo(x1 + 20, y1); path.LineTo(arrowPoint1X + 25, arrowPoint1Y - 5); path.MoveTo(x1 + 20, y1); path.LineTo(arrowPoint2X + 25, arrowPoint2Y + 5);
canvas.StrokeColor = (new SolidColorBrush(Color.FromArgb("#1D5B6F"))).Color;
#if ANDROID || IOS canvas.StrokeSize = 1;
#elif MACCATALYST || WINDOWS canvas.StrokeSize = 3;
#endif canvas.DrawPath(path); } }
public class NumericalAxisExt : NumericalAxis { protected override void DrawAxisLine(ICanvas canvas, float x1, float y1, float x2, float y2) { var path = new PathF(); path.MoveTo(x1, y1 + 20); path.LineTo(x2, y2);
// Calculate the direction vector of the line. float dx = x2 - x1; float dy = y2 - y1;
// Normalize the direction vector. float length = (float)Math.Sqrt(dx * dx + dy * dy); float nx = dx / length; float ny = dy / length;
// Length of the arrowhead. float arrowLength = 12;
// Calculate points for the arrowhead. float arrowPoint1X = x1 + nx * arrowLength + ny * arrowLength / 2; float arrowPoint1Y = y1 + ny * arrowLength - nx * arrowLength / 2; float arrowPoint2X = x1 + nx * arrowLength - ny * arrowLength / 2; float arrowPoint2Y = y1 + ny * arrowLength + nx * arrowLength / 2;
// Draw lines for the arrowhead. path.MoveTo(x1, y1 + 20 ); path.LineTo(arrowPoint1X + 5, arrowPoint1Y + 25); path.MoveTo(x1, y1 + 20 ); path.LineTo(arrowPoint2X - 5, arrowPoint2Y + 25);
canvas.StrokeColor = (new SolidColorBrush(Color.FromArgb("#1D5B6F"))).Color;
#if ANDROID || IOS canvas.StrokeSize = 1;
#elif MACCATALYST || WINDOWS canvas.StrokeSize = 3;
#endif canvas.DrawPath(path); } }
Let’s customize the other elements in the chart axis using the following properties:
- ShowMajorGridLines: To customize the visibility of the major grid lines.
- LabelStyle: To customize the style of the axis labels.
- MajorTickStyle: To customize the style of the major tick lines.
XAML
Customizing the series appearance
Let’s enhance the appearance of the chart’s series by customizing the corner radius and column colors.
XAML
C#
public class ArtificialIntelligenceData { public ObservableCollection CustomBrushes { get; set; }
public ArtificialIntelligenceData() { CustomBrushes = new ObservableCollection(); foreach (var item in Data) { if (item.Value < 50) { // Add the brush for values less than 50. CustomBrushes.Add(new SolidColorBrush(Color.FromArgb("#0DAA97"))); } else if (item.Value > 50 && item.Value < 100) { // Add a different brush for values between 50 to 100. CustomBrushes.Add(new SolidColorBrush(Color.FromArgb("#9455FC"))); } else { // Add the default brush for values greater than 100. CustomBrushes.Add(new SolidColorBrush(Color.FromArgb("#EA8D03"))); } } } }
In the code example above, we have specified the column color based on the investment value.
Adding the data labels
We can make the data easier to read by enabling and customizing the chart data labels.
Incorporating a plot area background view
Finally, incorporate a plot area background view to make our Column Chart more informative and attractive. With this, we can add any view to the chart plot area to include relevant data.
After executing the previous code examples, the output will resemble the following image.
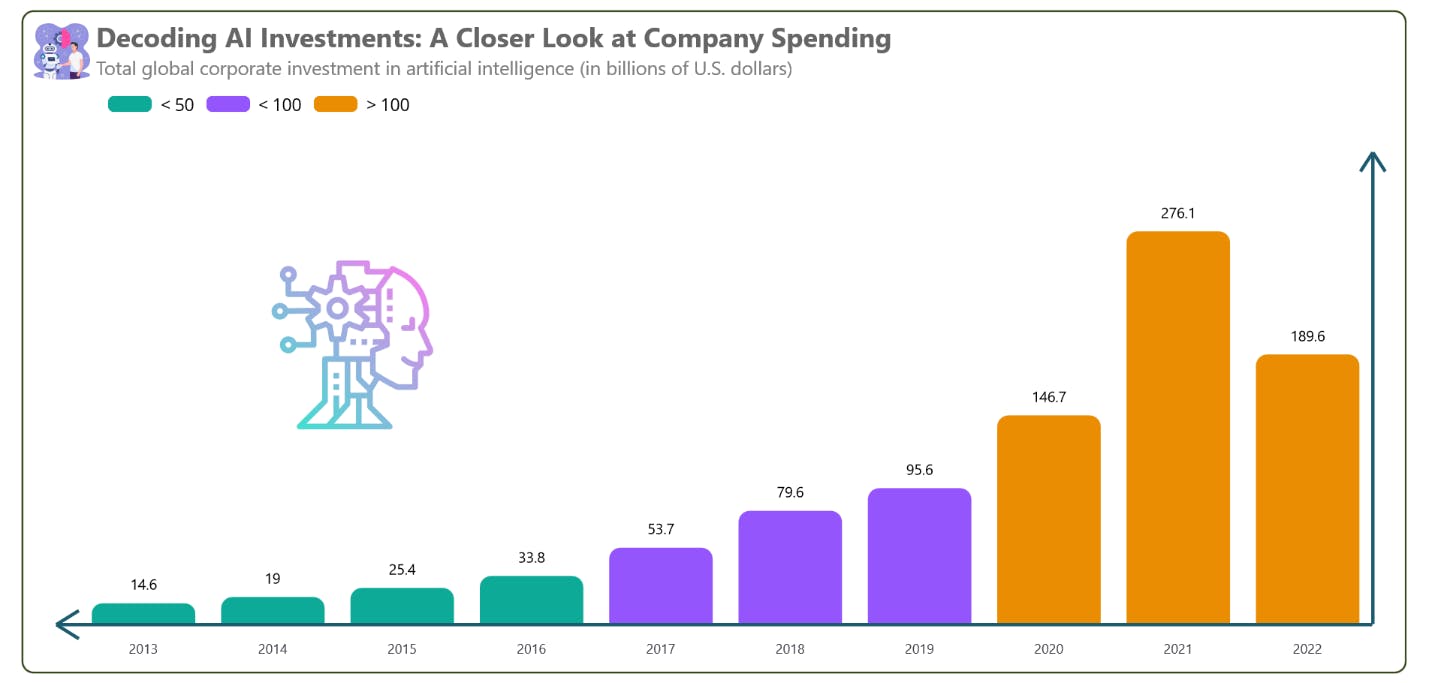
Visualizing the corporates’ investments in AI data using the Syncfusion .NET MAUI Column Chart
GitHub reference
For more details, refer to [Visualizing the Corporates’ investment in AI using .NET MAUI Column Chart GitHub demo](github.com/SyncfusionExamples/Creating-a-.N.. "Visualizing the corporates’ investment in AI using .NET MAUI Column Chart GitHub demo").
[

Supercharge your cross-platform apps with Syncfusion's robust .NET MAUI controls.
Try It Free
](syncfusion.com/downloads/maui)
Conclusion
Thank you for reading! In this blog, we have explored how to visualize the data on corporates’ investment in AI using the [Syncfusion .NET MAUI Column Chart](syncfusion.com/maui-controls/maui-cartesian.. ".NET MAUI Column Chart"). Please follow the steps outlined in this blog and share your feedback in the comments section below.
The existing customers can download the new version of Essential Studio on the [License and Downloads](syncfusion.com/account "Essential Studio License and Downloads page") page. If you are not a Syncfusion customer, try our 30-day [free trial](syncfusion.com/downloads "Get free evaluation of the Essential Studio products") to check out our incredible features.
You can also contact us via our [support forum](syncfusion.com/forums "Syncfusion Support Forum"), [support portal](support.syncfusion.com "Syncfusion Support Portal"), or [feedback portal](syncfusion.com/feedback "Syncfusion Feedback Portal"). We are always eager to help you!


Related blogs
- [Streamline Your Progress Navigation with the New .NET MAUI StepProgressBar](syncfusion.com/blogs/post/dotnet-maui-step-.. "Blog: Streamline Your Progress Navigation with the New .NET MAUI StepProgressBar")
- [Introducing the New .NET MAUI Rotator Control](syncfusion.com/blogs/post/dotnet-maui-rotat.. "Blog: Introducing the New .NET MAUI Rotator Control")
- [Introducing the New .NET MAUI Radial Menu Control](syncfusion.com/blogs/post/dotnet-maui-radia.. "Blog: Introducing the New .NET MAUI Radial Menu Control")
- [Easily Fill and Share a PDF Form using .NET MAUI PDF Viewer](syncfusion.com/blogs/post/fill-share-pdf-fo.. "Blog: Easily Fill and Share a PDF Form using .NET MAUI PDF Viewer")