#ui
Read more stories on Hashnode
Articles with this tag
TL;DR: Are you using Power BI for your business analytics needs? Integrating the Syncfusion JavaScript Gantt Chart elevates your data visualization...
TL;DR: Learn to export your grid data to a PDF file using the Syncfusion .NET MAUI DataGrid control with custom export options like excluding columns...
TL;DR: Are you seeking a tool to visualize your complex hierarchical data? Dive into the WinUI DataGrid’s master details view! Learn to represent...
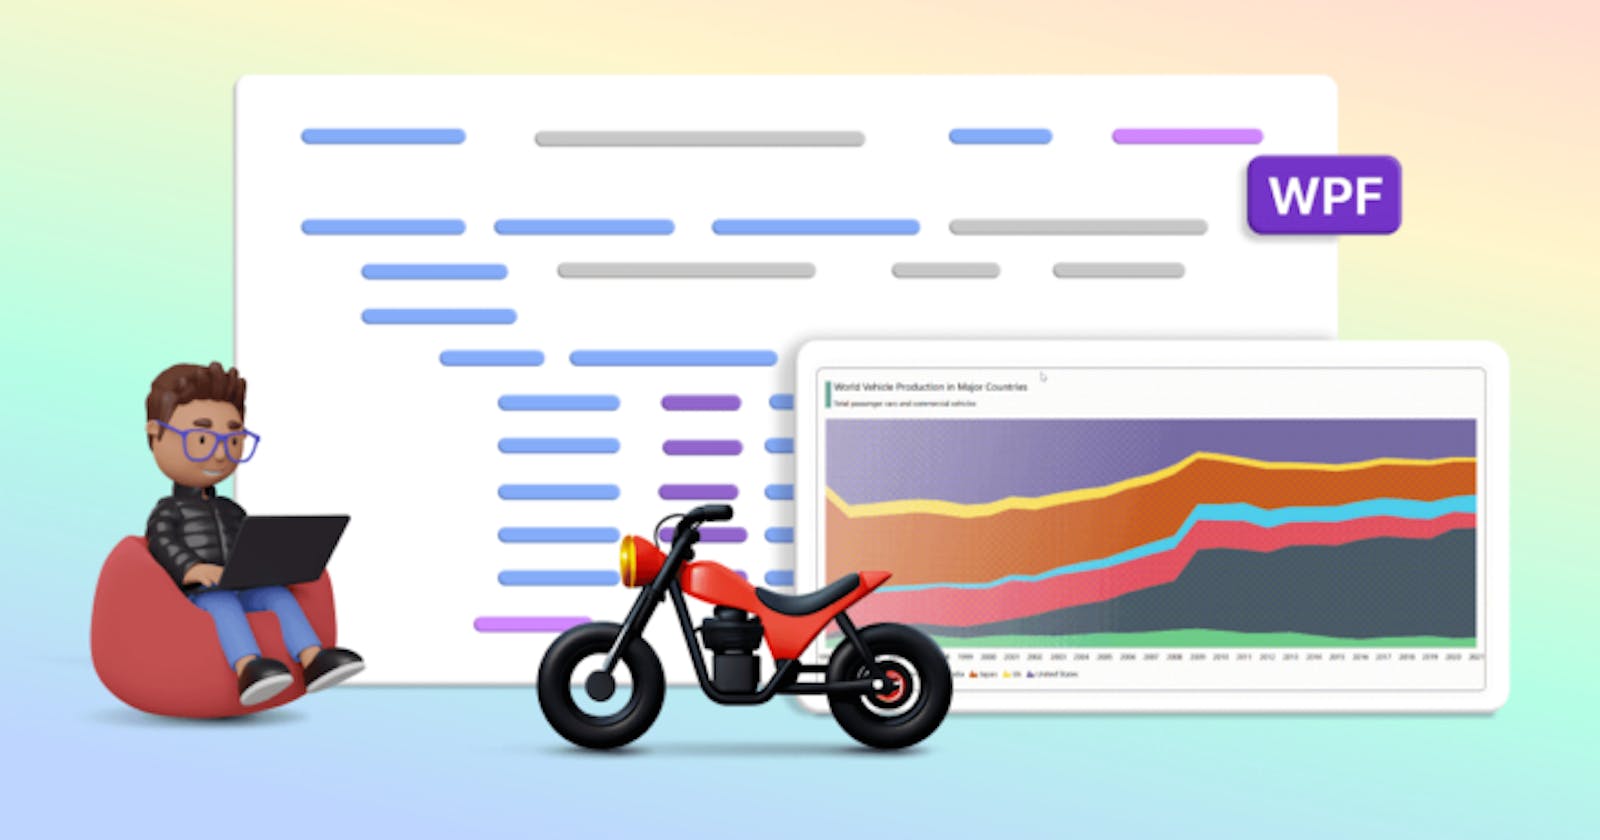
TL;DR: Let’s collect and showcase the world vehicle production data across major countries using the Syncfusion WPF 100% Stacked Area Chart. We will...
TL;DR: Looking to simplify the creation of complex queries? Look no further! Syncfusion React Query Builder is your go-to solution — a user-friendly,...
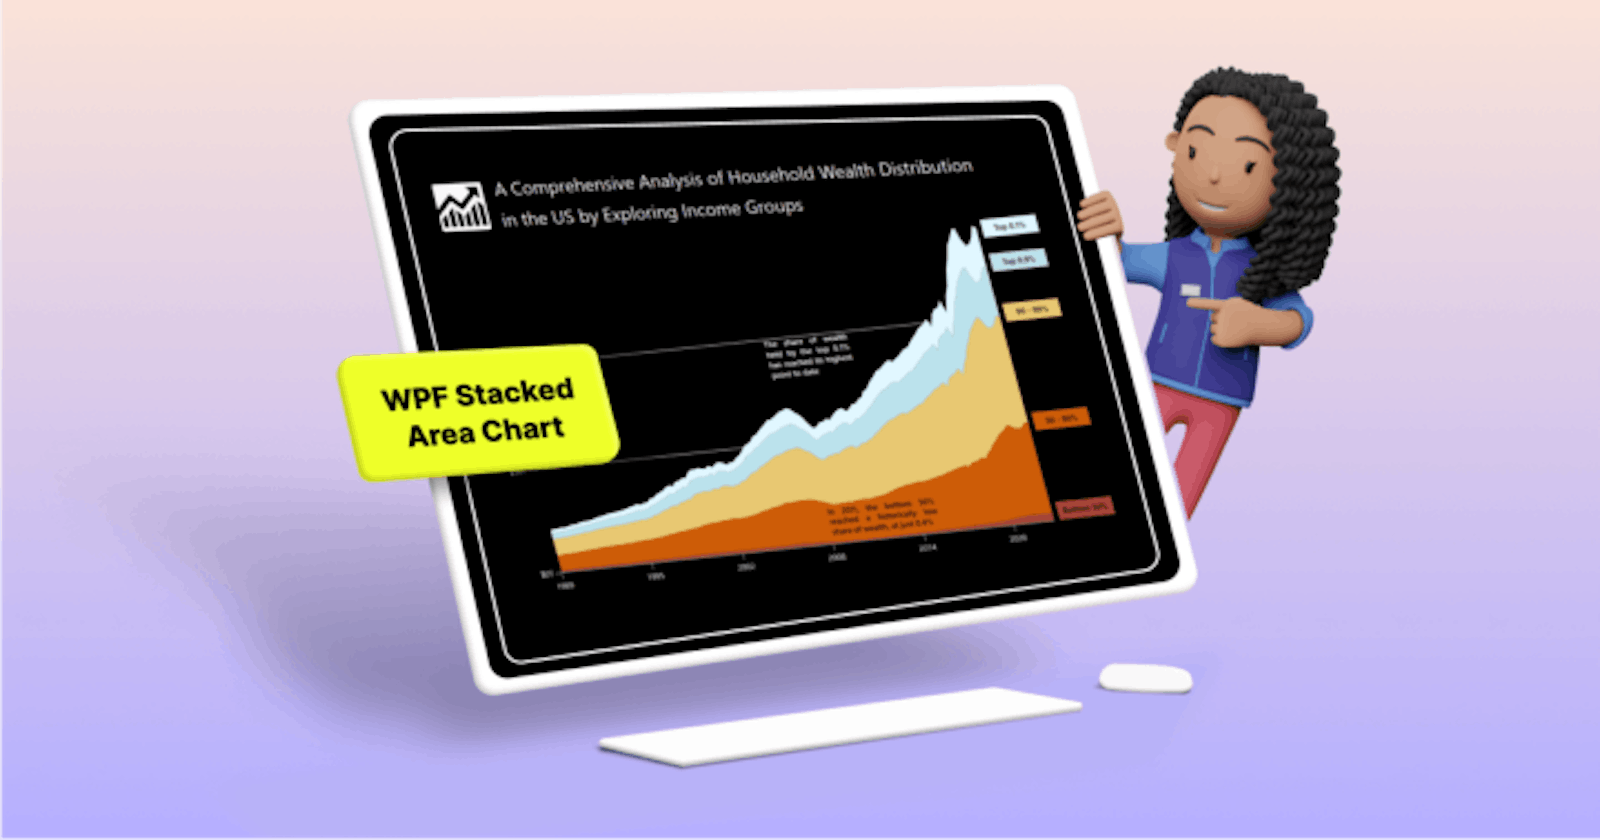
TL;DR: Learn to visualize wealth distribution in the U.S. from 1990 to 2023 using Syncfusion WPF Stacked Area Chart. Explore a step-by-step guide on...