

Introducing the New .NET MAUI Polar Charts Control


TLDR: Exploring the new Syncfusion .NET MAUI Polar Charts control and visualizing data with its marvelous features and code examples.
We are glad to introduce the new [.NET MAUI Polar Charts](syncfusion.com/maui-controls/maui-polar-cha.. ".NET MAUI Polar Charts") control in our [Essential Studio 2024 Volume 1](syncfusion.com/forums/187257/essential-stud.. "Essential Studio 2024 Volume 1") release.
The .NET MAUI Polar Charts control enhances visualization by elegantly representing data in terms of values and angles, making it an essential component for crafting visually appealing and informative .NET MAUI applications.
Polar charts help visualize cyclical data patterns, such as seasonal trends, periodic fluctuations, and directional relationships.
Let’s explore the features of the .NET MAUI Polar Charts control!
Key features
The key features of the .NET MAUI Polar Charts control include:
Chart types
Polar Area Chart
The Polar Area Chart helps us to show data in a circular pattern, compare values, and provide a clear and engaging way to present complex information.
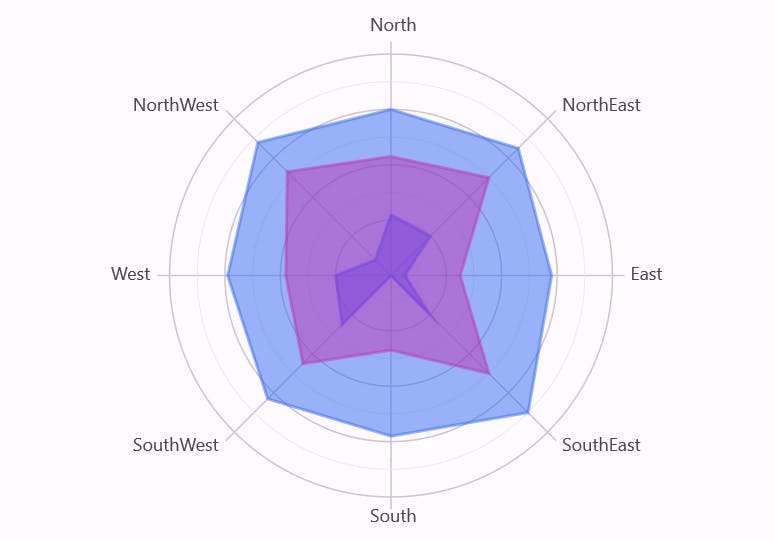
.NET MAUI Polar Area Chart
Polar Line Chart
Each data point is represented as a particular location along a radial line in a Polar Line Chart.
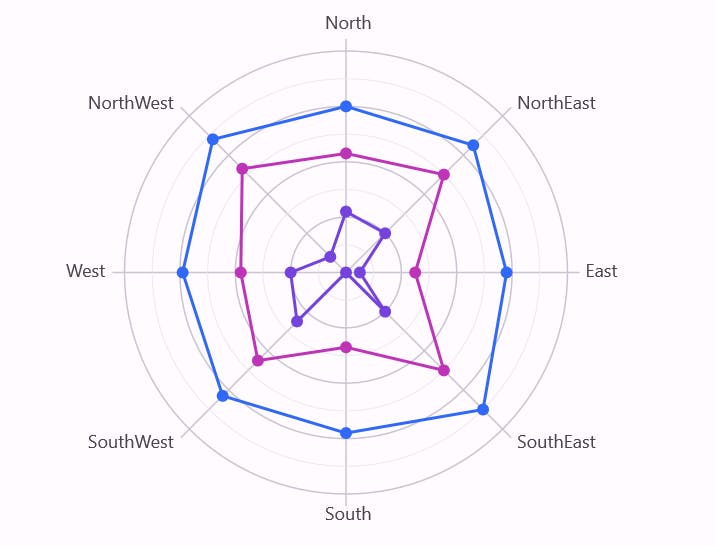
.NET MAUI Polar Line Chart
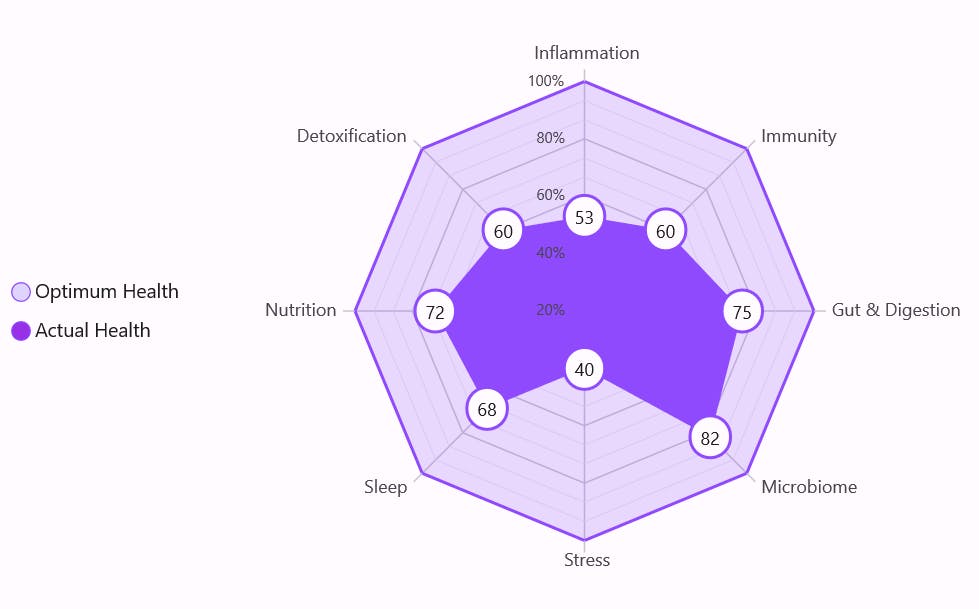
Radar Area Chart
The Radar Area Chart displays data points that are visualized as areas within a polygon gridline.

.NET MAUI Radar Area Chart
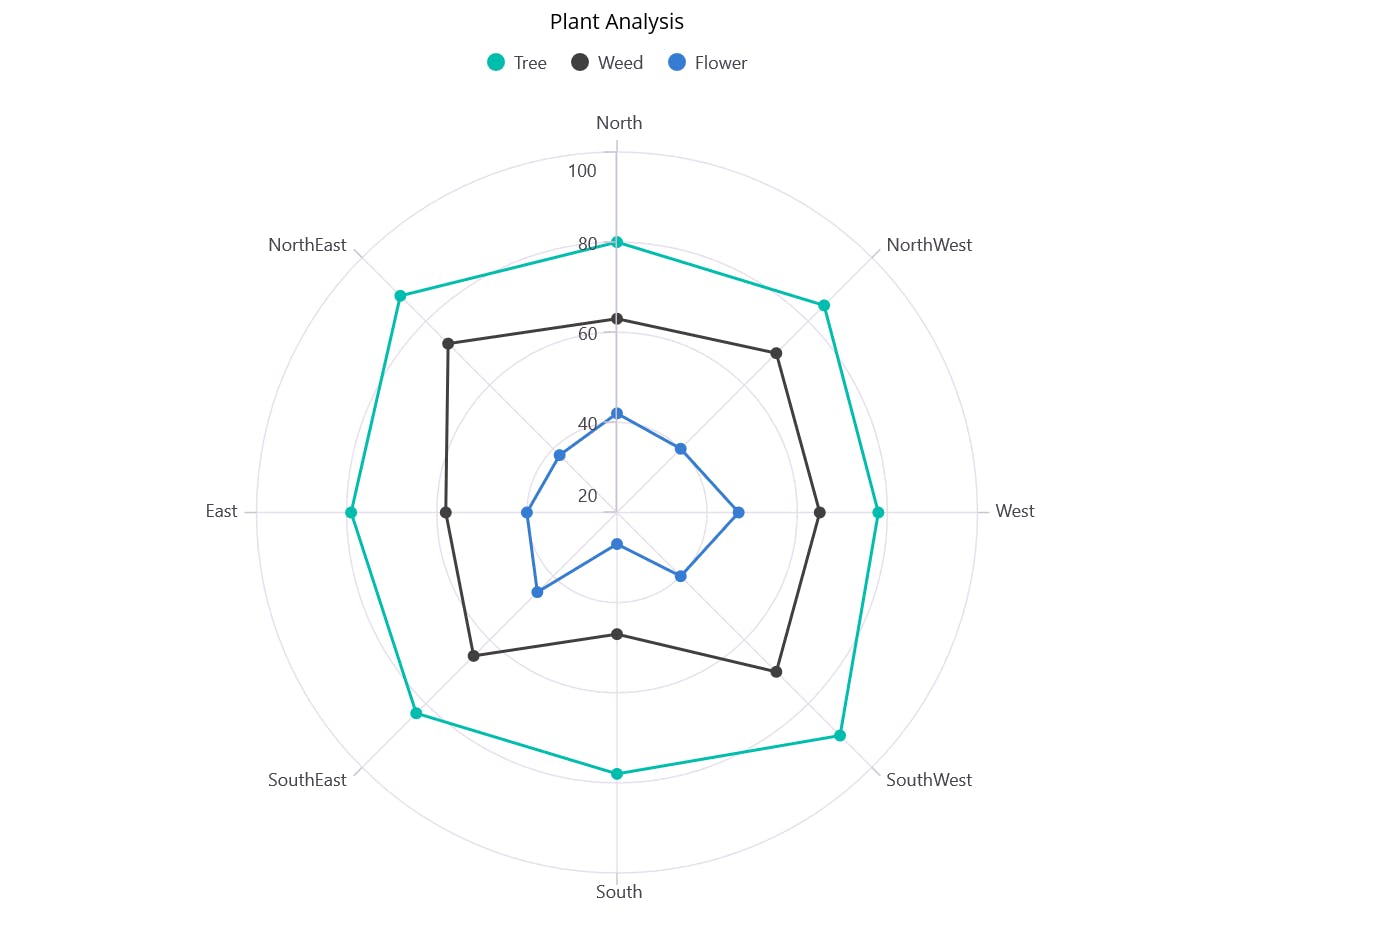
Radar Line Chart
The Radar Line Chart displays data points that are visualized as a line in a polygon gridline.
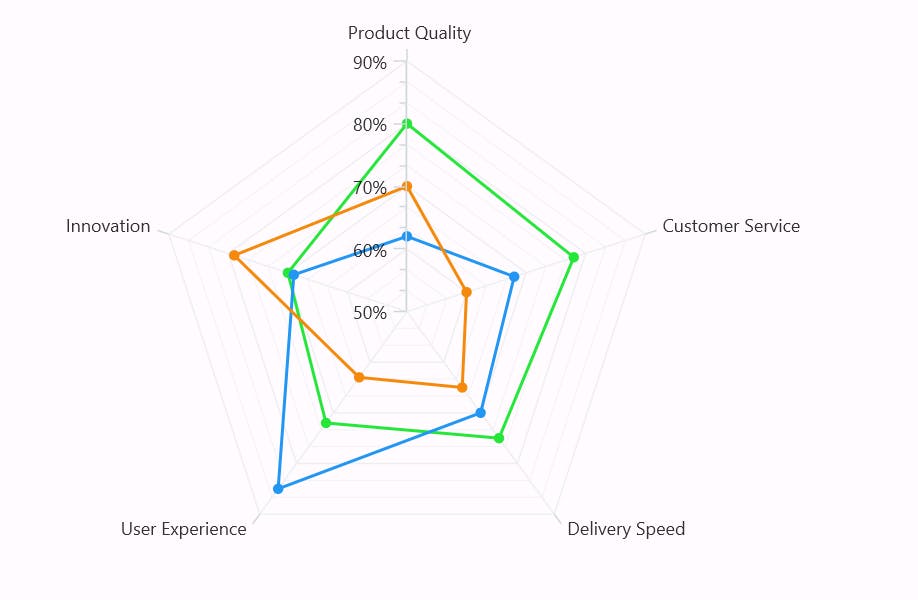
.NET MAUI Radar Line Chart
Tooltips
Enhance user interaction and data exploration with tooltips that provide additional information about individual segments on the chart. Users can gain insights by hovering over data points and accessing relevant details.
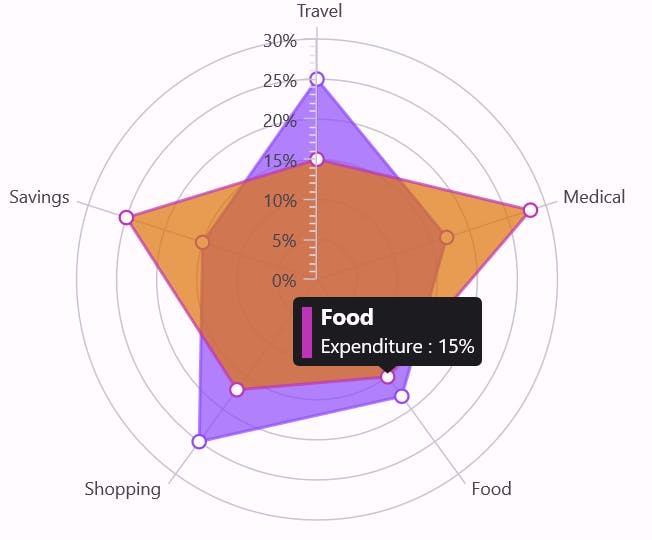
Tooltips in .NET MAUI Polar Charts control
Data labels
Enhance readability and comprehension by adding data labels to your Polar Chart. Label the data points to provide context and significance.
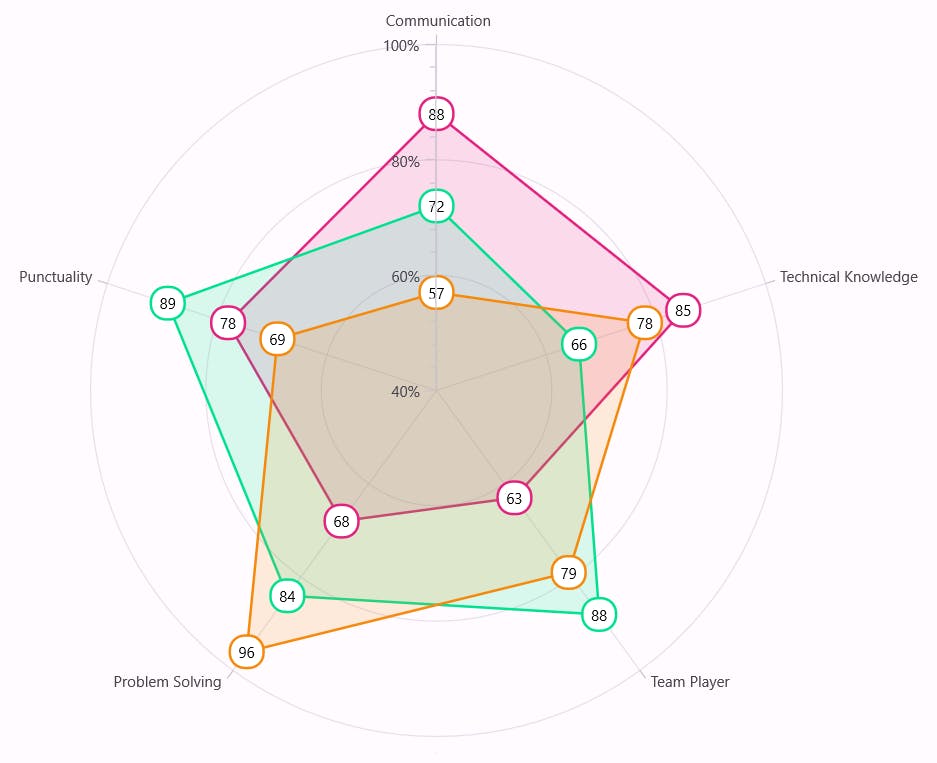
Data labels in .NET MAUI Polar Charts control
Legends
Use the legends to provide a quick reference guide to understand the chart’s content briefly. Legends offer a visual representation of data series, making it easier for users to interpret the chart.
Legends in .NET MAUI Radar Area Chart
Note: For more details, refer to the [.NET MAUI Polar Charts control documentation](help.syncfusion.com/maui/polar-charts/getti.. "Getting started with .NET MAUI Polar Charts").
Getting started with the .NET MAUI Polar Charts control
We’ve explored the features of the .NET MAUI Polar Charts control. Let’s see the steps to integrate it into your .NET MAUI app.
Step 1: Create a .NET MAUI app
First, create a [.NET MAUI application.](learn.microsoft.com/en-us/dotnet/maui/get-s.. "Build your first .NET MAUI application")
Step 2: Add the required NuGet package
Syncfusion .NET MAUI controls are available on the [NuGet Gallery](nuget.org "NuGet Gallery"). To add the .NET MAUI Polar Charts control to your project, open the NuGet package manager in [Visual Studio](visualstudio.microsoft.com "Visual Studio"). Search for Syncfusion.Maui.Charts and then install it.
Step 3: Register the handler
Now, register the handler for the Syncfusion core in the MauiProgram.cs file.
using Microsoft.Maui; using Microsoft.Maui.Hosting; using Microsoft.Maui.Controls.Compatibility; using Microsoft.Maui.Controls.Hosting; using Microsoft.Maui.Controls.Xaml; using Syncfusion.Maui.Core.Hosting;
namespace SunburstGettingStarted { public static class MauiProgram { public static MauiApp CreateMauiApp() { var builder = MauiApp.CreateBuilder(); builder .UseMauiApp() .ConfigureSyncfusionCore() .ConfigureFonts(fonts => { fonts.AddFont("OpenSans-Regular.ttf", "OpenSansRegular"); });
return builder.Build(); } } }
Step 4: Add the namespace
Add the Syncfusion.Maui.**Charts** namespace in your XAML page.
. . .Step 5: Initialize the Syncfusion .NET MAUI Polar Charts control
Finally, initialize the .NET MAUI Polar Charts control with the data, as shown in the following code example.
After executing the above code examples, we will get the output that resembles the following image.
Visualizing data using the .NET MAUI Polar Charts control
GitHub references
Also, refer to the [.NET MAUI Polar Charts control GitHub demo](github.com/SyncfusionExamples/Creating-a-Ge.. ".NET MAUI Polar Charts control GitHub demo").
[

Supercharge your cross-platform apps with Syncfusion's robust .NET MAUI controls.
Try It Free
](syncfusion.com/downloads/maui)
Conclusion
Thanks for reading! In this blog, we’ve explored the features of the new Syncfusion [.NET MAUI Polar Charts](syncfusion.com/maui-controls/maui-polar-cha.. ".NET MAUI Polar Charts") control added in the [2024 Volume 1](syncfusion.com/forums/187257/essential-stud.. "Essential Studio 2024 Volume 1") release. You can learn more about the latest .NET MAUI advancements on our [Release Notes](help.syncfusion.com/common/essential-studio.. "Essential Studio Release Notes") and [What’s New](syncfusion.com/products/whatsnew "Essential Studio What’s New") pages. Try them out and leave your feedback in the comments section below!
Download the [Essential Studio for .NET MAUI](syncfusion.com/downloads/maui "Get free evaluation of Essential Studio for .NET MAUI") to start evaluating the controls immediately.
You can also contact us through our [support forum](syncfusion.com/forums "Syncfusion Support Forum"), [support portal](support.syncfusion.com "Syncfusion Support Portal"), or [feedback portal](syncfusion.com/feedback "Syncfusion Feedback Portal"). We are always happy to help you!


Related blogs
- [Chart of the Week: Creating a .NET MAUI Column Chart to Visualize the Corporate Investment in AI](syncfusion.com/blogs/post/maui-column-chart.. "Blog: Chart of the Week: Creating a .NET MAUI Column Chart to Visualize the Corporate Investment in AI")
- [Introducing the New .NET MAUI TreeMap Control](syncfusion.com/blogs/post/dotnet-maui-treem.. "Blog: Introducing the New .NET MAUI TreeMap Control")
- [Streamline Your Progress Navigation with the New .NET MAUI StepProgressBar](syncfusion.com/blogs/post/dotnet-maui-step-.. "Blog: Streamline Your Progress Navigation with the New .NET MAUI StepProgressBar")
- [Introducing the New .NET MAUI Rotator Control](syncfusion.com/blogs/post/dotnet-maui-rotat.. "Blog: Introducing the New .NET MAUI Rotator Control")